|
A microarray experiment will most often require a uniquely tailored analysis to best bring out the information hidden in the data. We have therefore developed a data- and hypothesis driven, flexible analysis approach where the structure of the data, the specific focus points of project partners, as well as the newest microarray analysis research results and available bioinformatics databases are used to select and design the optimal analysis tools. Often, these tools build on well established machine learning and statistical techniques, however, when needed, we develop them in-house.
Below we describe the general steps, “from bench to bedside”, in a microarray analysis project
| Experimental design |
| |
|
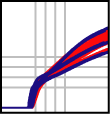
Research goals and hypothesis are used to formulate experimental designs that are expected to yield the highest power and predictive value. Pilot studies or publicly available similar studies are used to calculate cost-benefit curves to help in the decision of the optimal number of biological replicates, etc.
|
|
|
| Preprocessing of raw data |
| |
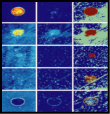
Scanned fluorescence images from spotted microarrays are segmented into spot and background and the results stored as intensity values. Some commercial products, like the Affymetrix GeneChips, does this automatically (results stored in CEL files). The quality of the hybridization is checked. Background fluorescence is removed from spot intensities and summary values are calculated. To make gene expressions comparable across microarrays, intensities are scaled, normalized, and variance stabilized.
|
|
|
| Data analysis |
| |
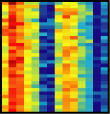
Differentially regulated genes are detected using an ensemble of parametric and non-parametric hypothesis tests. Genes/samples with similar expression profiles are detected using clustering and classification techniques. Dimensionality reduction and visualization is used to explore the global data structure. Results are compared to publicly available microarray studies when possible to validate and extrapolate results.
|
|
|
| Data annotation and integration |
| |
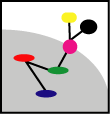
Groups of informative genes identified in the data analysis step are annotated and mapped to pathways. Key functions, processes, and pathways are identified. We search for shared transcription factor binding sites among clusters of genes with highly similar expression profiles. Protein-protein interaction data as well as textmining of literature databases are used to establish additional relations between gene products.
|
|
|
| Results presentation |
| |
To make results as easily accessible as possible, they are collected and listed together in a few spreadsheet files. Accompanying figures and graphs are collected in presentations. Detailed information about analyses parameters, etc. is stored in text documents for reference.
|
|
|
| Validation and follow-up experiments |
| |
Based on the hypotheses generated from the results, possible validation and follow-up experiments are discussed. For example, an often used approach is to validate the expression of selected genes using qPCR. Here, stably expressed reference genes are needed and can be identified as part of the data analysis.
|
|
|
|